How you can use this image
This image is available to be shared and re-used under the terms of the Creative Commons Attribution licence (CC BY). This image can be used in any way, for commercial or non-commercial purposes.
Wherever you reproduce the image or an altered version of it, you must attribute the original creators (acknowledge the original artist(s), the person/organisation that took the photograph of the work) and any other stated rights holders.
Review our guidance pages which explain how you can reuse images, how to credit an image and how to find more images in the public domain or with a Creative Commons licence available.
DownloadNotes
Add or edit a note on this artwork that only you can see. You can find notes again by going to the ‘Notes’ section of your account.
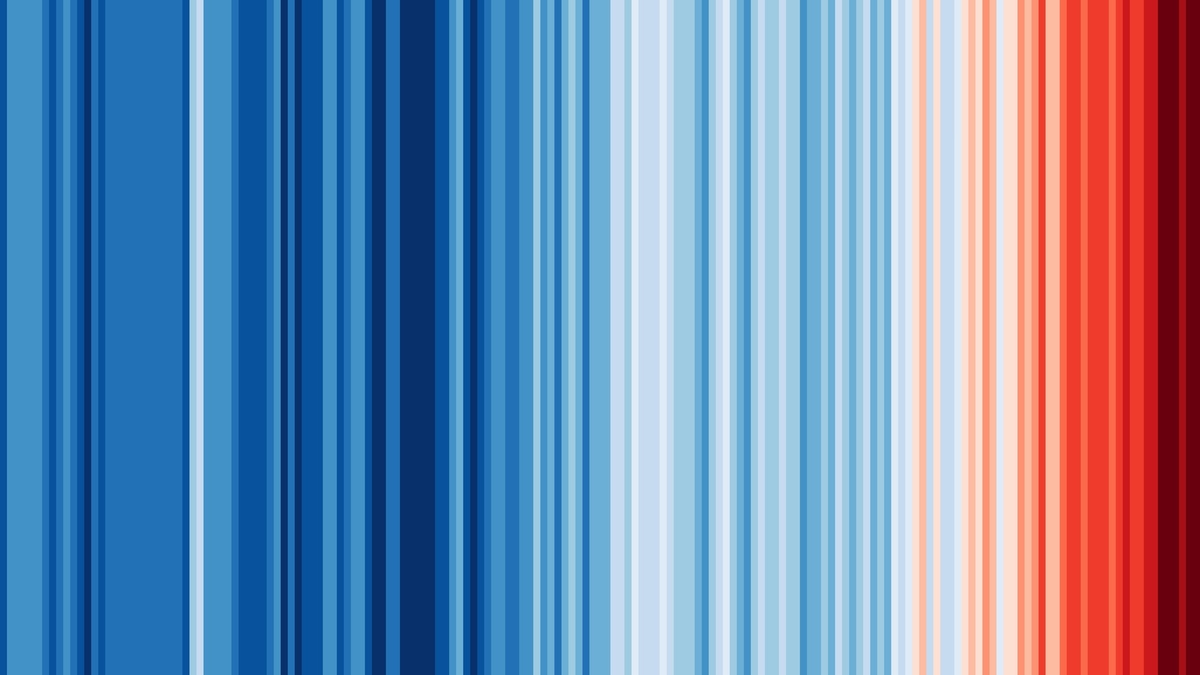
This version of the 'Climate Stripes' was created in 2021 and shows changes in global temperatures between 1850 and 2020.
Title
Climate Stripes: Warming Stripes, Global, 2020
Date
2021
Medium
digital
Accession number
UAC/11018
Acquisition method
donation, 2021
Work type
Digital art


